Loki with Grafana‘s UI is very useful in grepping and debugging big log files. Specially when you have multiple instances of a micro-service running, each emitting logs in individual files.
There can be times when you want to install Loki on your laptop and query some log files stored locally. Let us see the steps to achieve this.
Install Grafana and Loki locally
First, we need to install Grafana and Loki using their
- Make sure you have docker desktop installed.
- Create a new directory for Loki installation and related files. We will call this loki_folder.
- Create folder logs in loki_folder. This is where we will copy all our log files which we need to see in Grafana.
- Create promtail_config.yaml in loki_folder and paste below config into it.
server:
  http_listen_port: 9080
  grpc_listen_port: 0

positions:
  filename: /tmp/positions.yaml

clients:
  - url: http://loki:3100/loki/api/v1/push

scrape_configs:
- job_name: system
  static_configs:
  - targets:
      - localhost
    labels:
      job: varlogs
      __path__: /logs/**/*log*
- Now create docker-compose.yaml in loki_folder and paste the below code in it. Make sure to replace loki_folder_path in this file with absolute path of loki_folder from step 2
version: "3"

networks:
  loki:

services:
  loki:
    image: grafana/loki
    ports:
      - "3100:3100"
    networks:
      - loki

  promtail:
    image: grafana/promtail
    volumes:
      - loki_folder_path/promtail_config.yaml:/etc/promtail/config.yaml
      - loki_folder_path/logs:/logs
    command: -config.file=/etc/promtail/config.yaml
    networks:
      - loki

  grafana:
    image: grafana/grafana
    ports:
      - "3000:3000"
    networks:
      - loki
- We have everything that is needed to run Loki now. In loki_folder, run
docker-compose up -d
* To stop these containers in future, from the same folder run docker-compose down * - Above step will fetch and start all the required dockers (Promtail, Loki and Grafana).
Configure Grafana to use Loki
Now that we have installed everything, let us configure Loki as a data source for Grafana. Continue from step-6 above i.e. all dockers containers are up.
- Go to Grafana at http://localhost:3000 . Default username and password is admin/admin
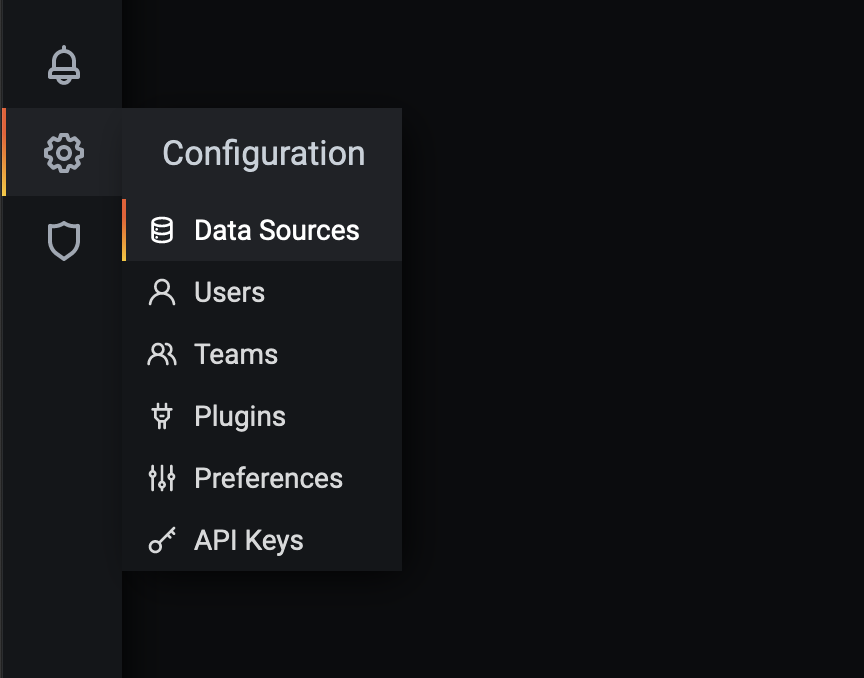
- Click on Data Sources under Configuration menu option. As shown in below image.

- Select Loki
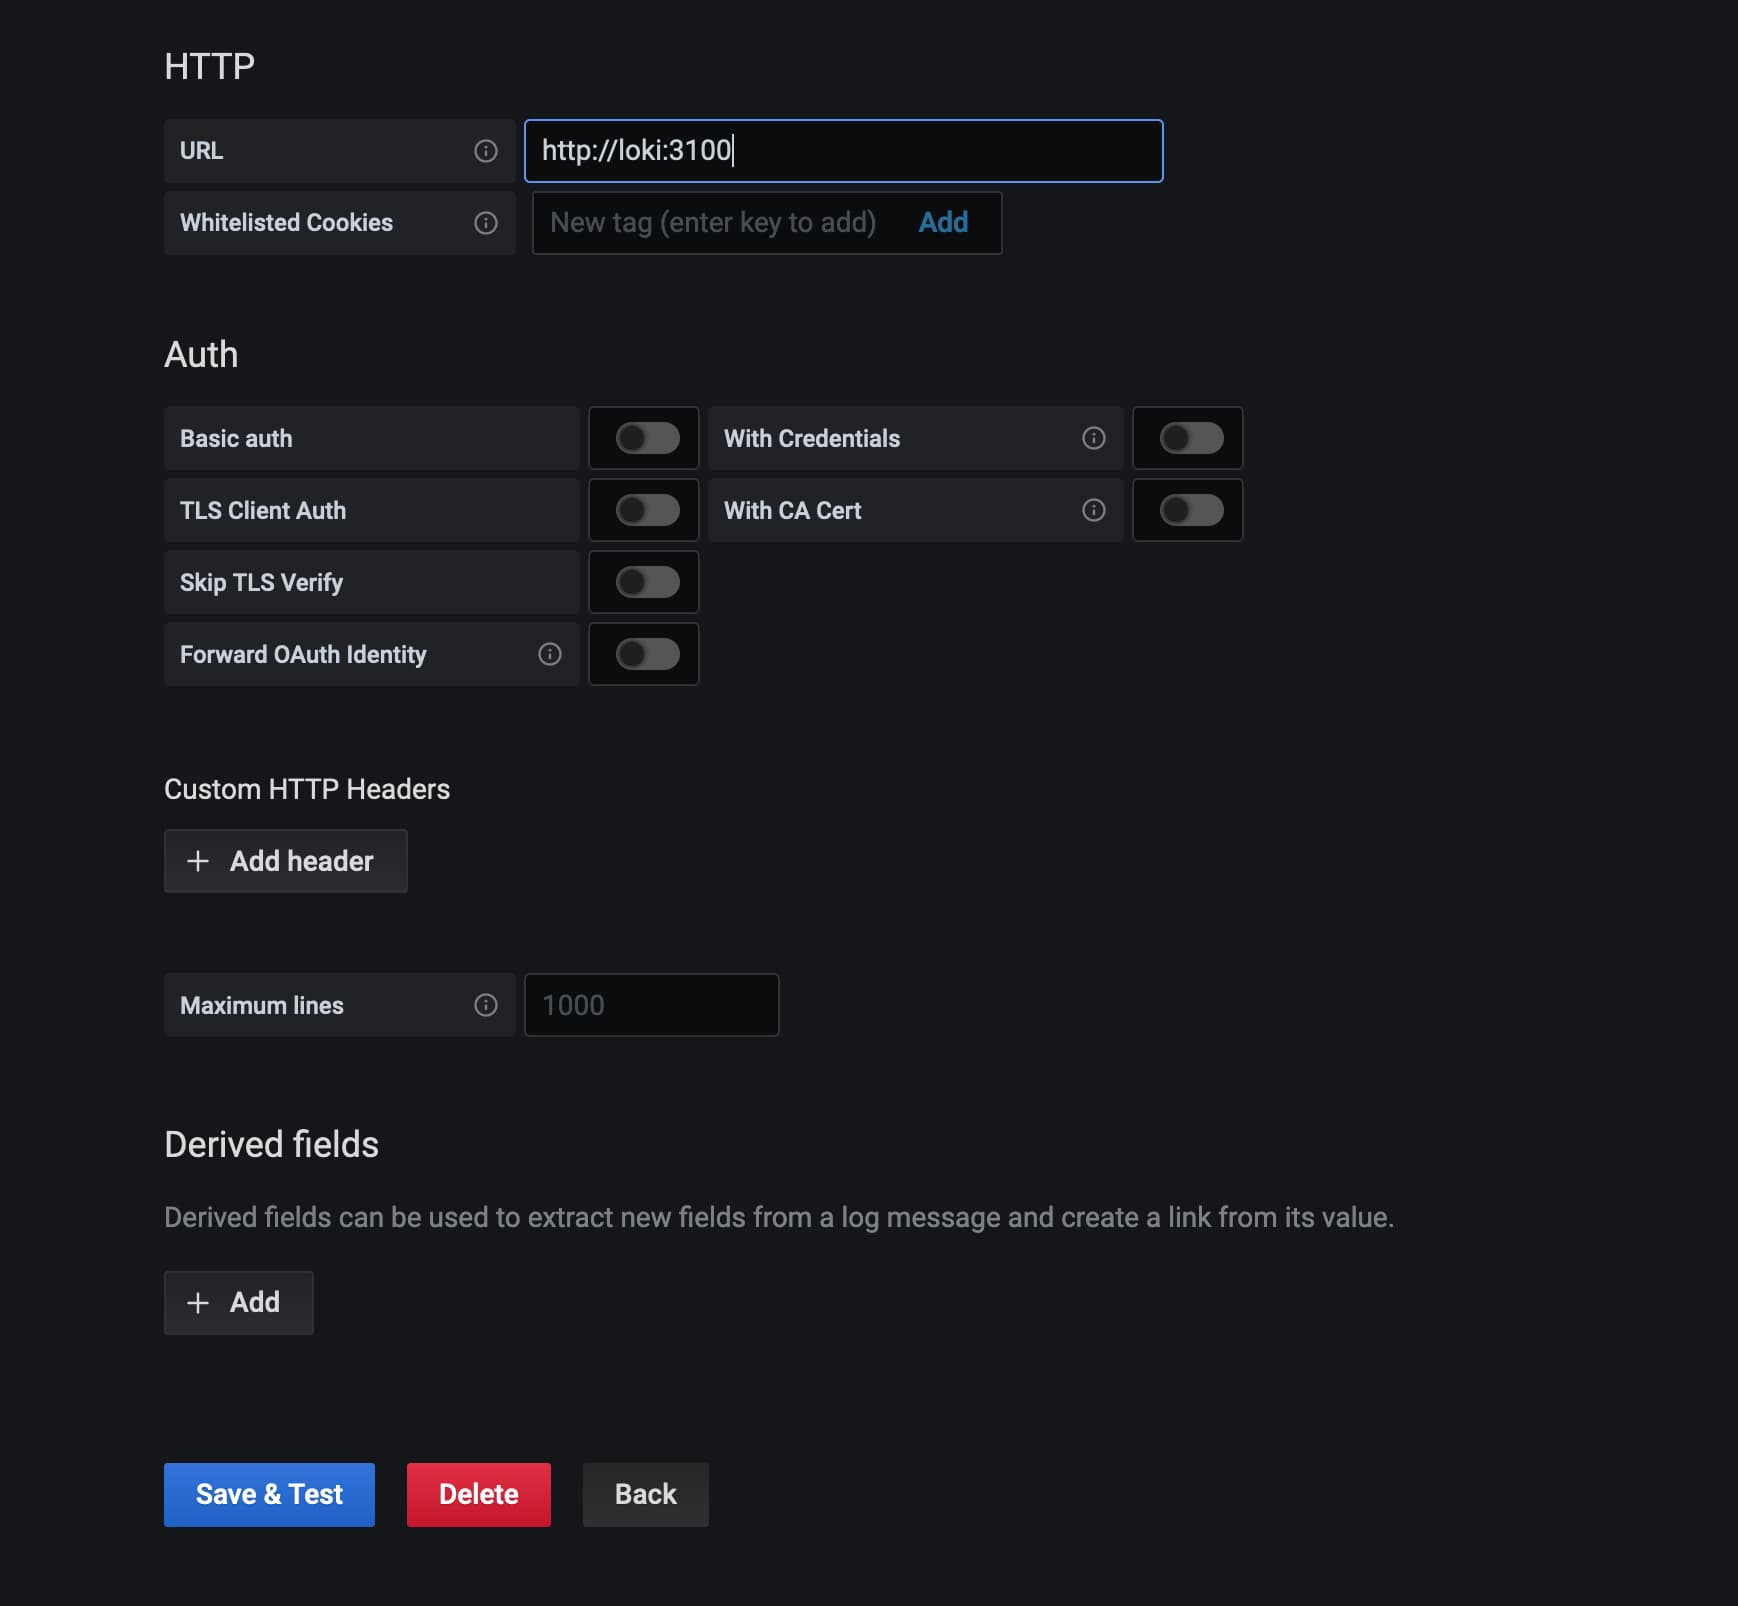
- Put URL as http://loki:3100 (yes it is loki: not localhost: )

- Click “Save & Test”. We have successfully configured local Loki as data source for Grafana if no error is shown.
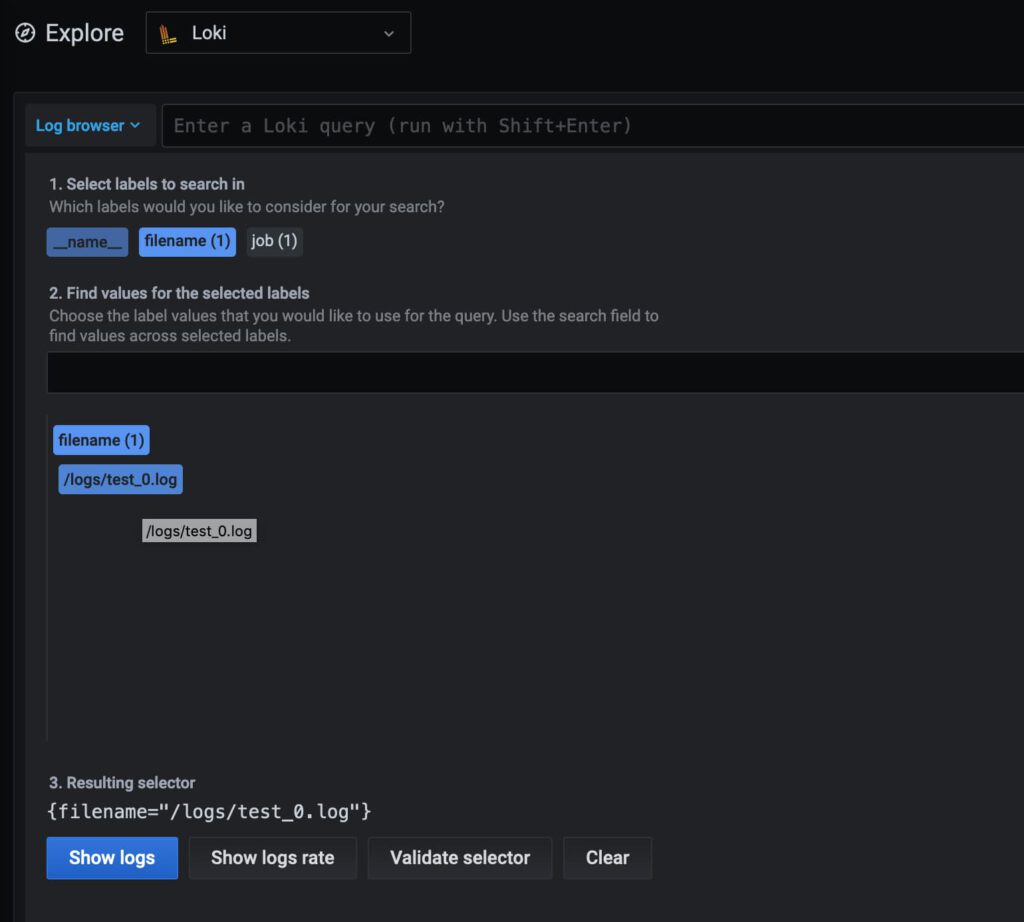
- Now click on “Explore” from left menu and select Loki in the top dropdown.
You are all set to use Loki with your log files.
Query local log file(s)
All the log files that you want to query in Loki, must be copied to loki_folder/logs . This folder is volume mounted to the promtail docker container hence any new file added here is available for promtail to push to Loki.
Once logs are copied, sometimes you may need to refresh Grafana for these files to show up.
To select a file, either use the “Log browser” drop down and select the file (as shown below) or type in the query box → {filename=”/log/test.log”} ← This is just an example of complete path of the log file.

Using this approach we can run any LogQL query on all the log files.
Happy Debugging!
